Visualising Simulation
The results from a DL_MESO_LBE simulation includes periodic snapshots of the system in VTK files, usually ending in .vts for structured grids, essentially as a trajectory. These can be visualised and analysed by loading them into a visualisation package designed to look at grid-based data, i.e.
The data is already in a form that can be read in and visualised and/or manipulated for analysis. (There are also Python scripts available to read these files and work out particular properties.)
ParaView:
ParaView can automatically open a numbered sequence of VTK files and visualise them each in turn, including generating an animation showing how the simulation has progressed. After selecting the group of lbout*.vts files and opening them, you then need to click Apply in the Properties window to load in the data and create a visualisation. Pull-down boxes indicating which data are being visualised and the type of visualisation are then made available, and controls are also available to play through or select the available frames.
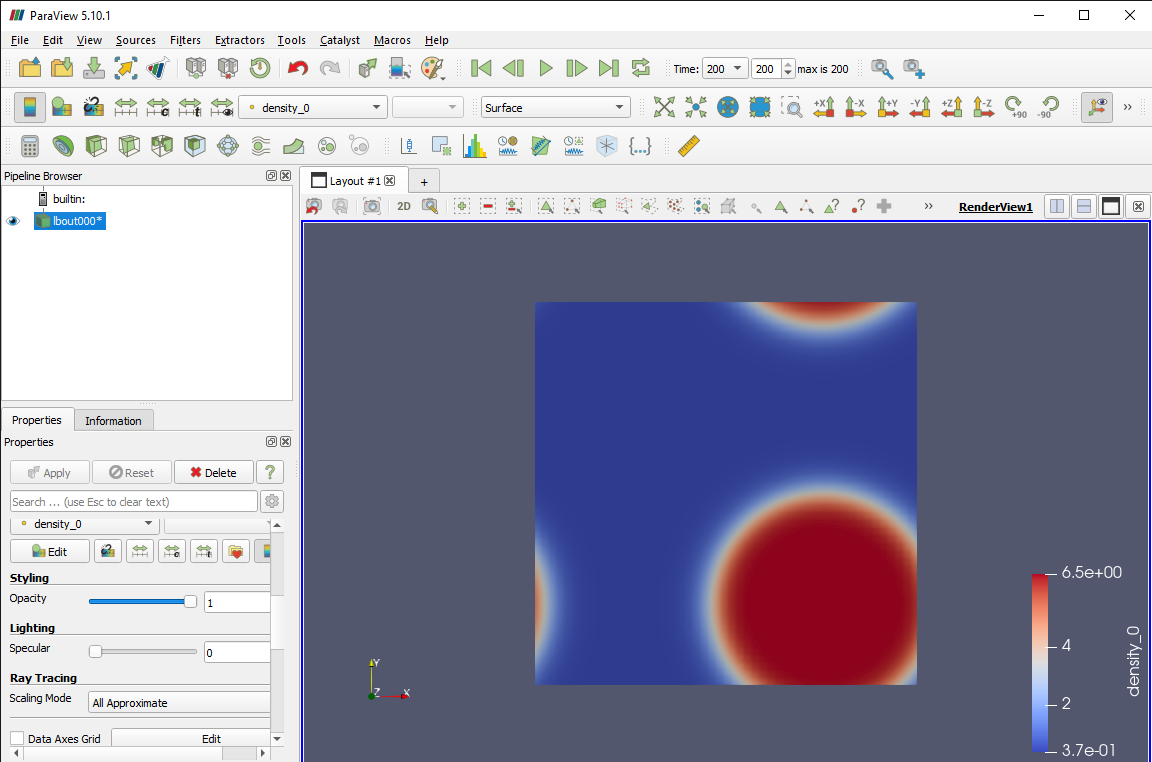
In the above, the fluid densities in last frame of the vapour-liquid simulation using Shan-Chen interactions are shown. The colour scale indicates the available values, including maxima and minima related to the bulk liquid and vapour densities respectively. (This information is also available in the Information window.)
Any of the supplied data in the files can be manipulated in ParaView by using filters. Among many others, these include:
- Calculator: uses the values of existing properties at each grid point to come up with new properties
- Contour: draw lines for various values of a given property
- Plot Over Line: creates a graph of all available properties along a user-specified line through the simulation domain
- Glyph: draws arrows or similar objects indicating directions (and magnitudes) of flows
- Stream Tracer: generates streamlines of fluid flows
- Slice: cuts through a three-dimensional grid and visualises a cross-section along a selected axis or direction
Note that these filters come up with further properties or values that can be plotted on the grid, rather than single system-wide values.