Protein-protein interactions
The human SOD1 is a bimetallic protein enzyme, functionally active as a homodimer orientated by an approximate 2-fold axis along the dimeric interface. The interfacial region between the subunits are stabilised by both polar and apolar contacts between the amino acids residues from both monomer units.
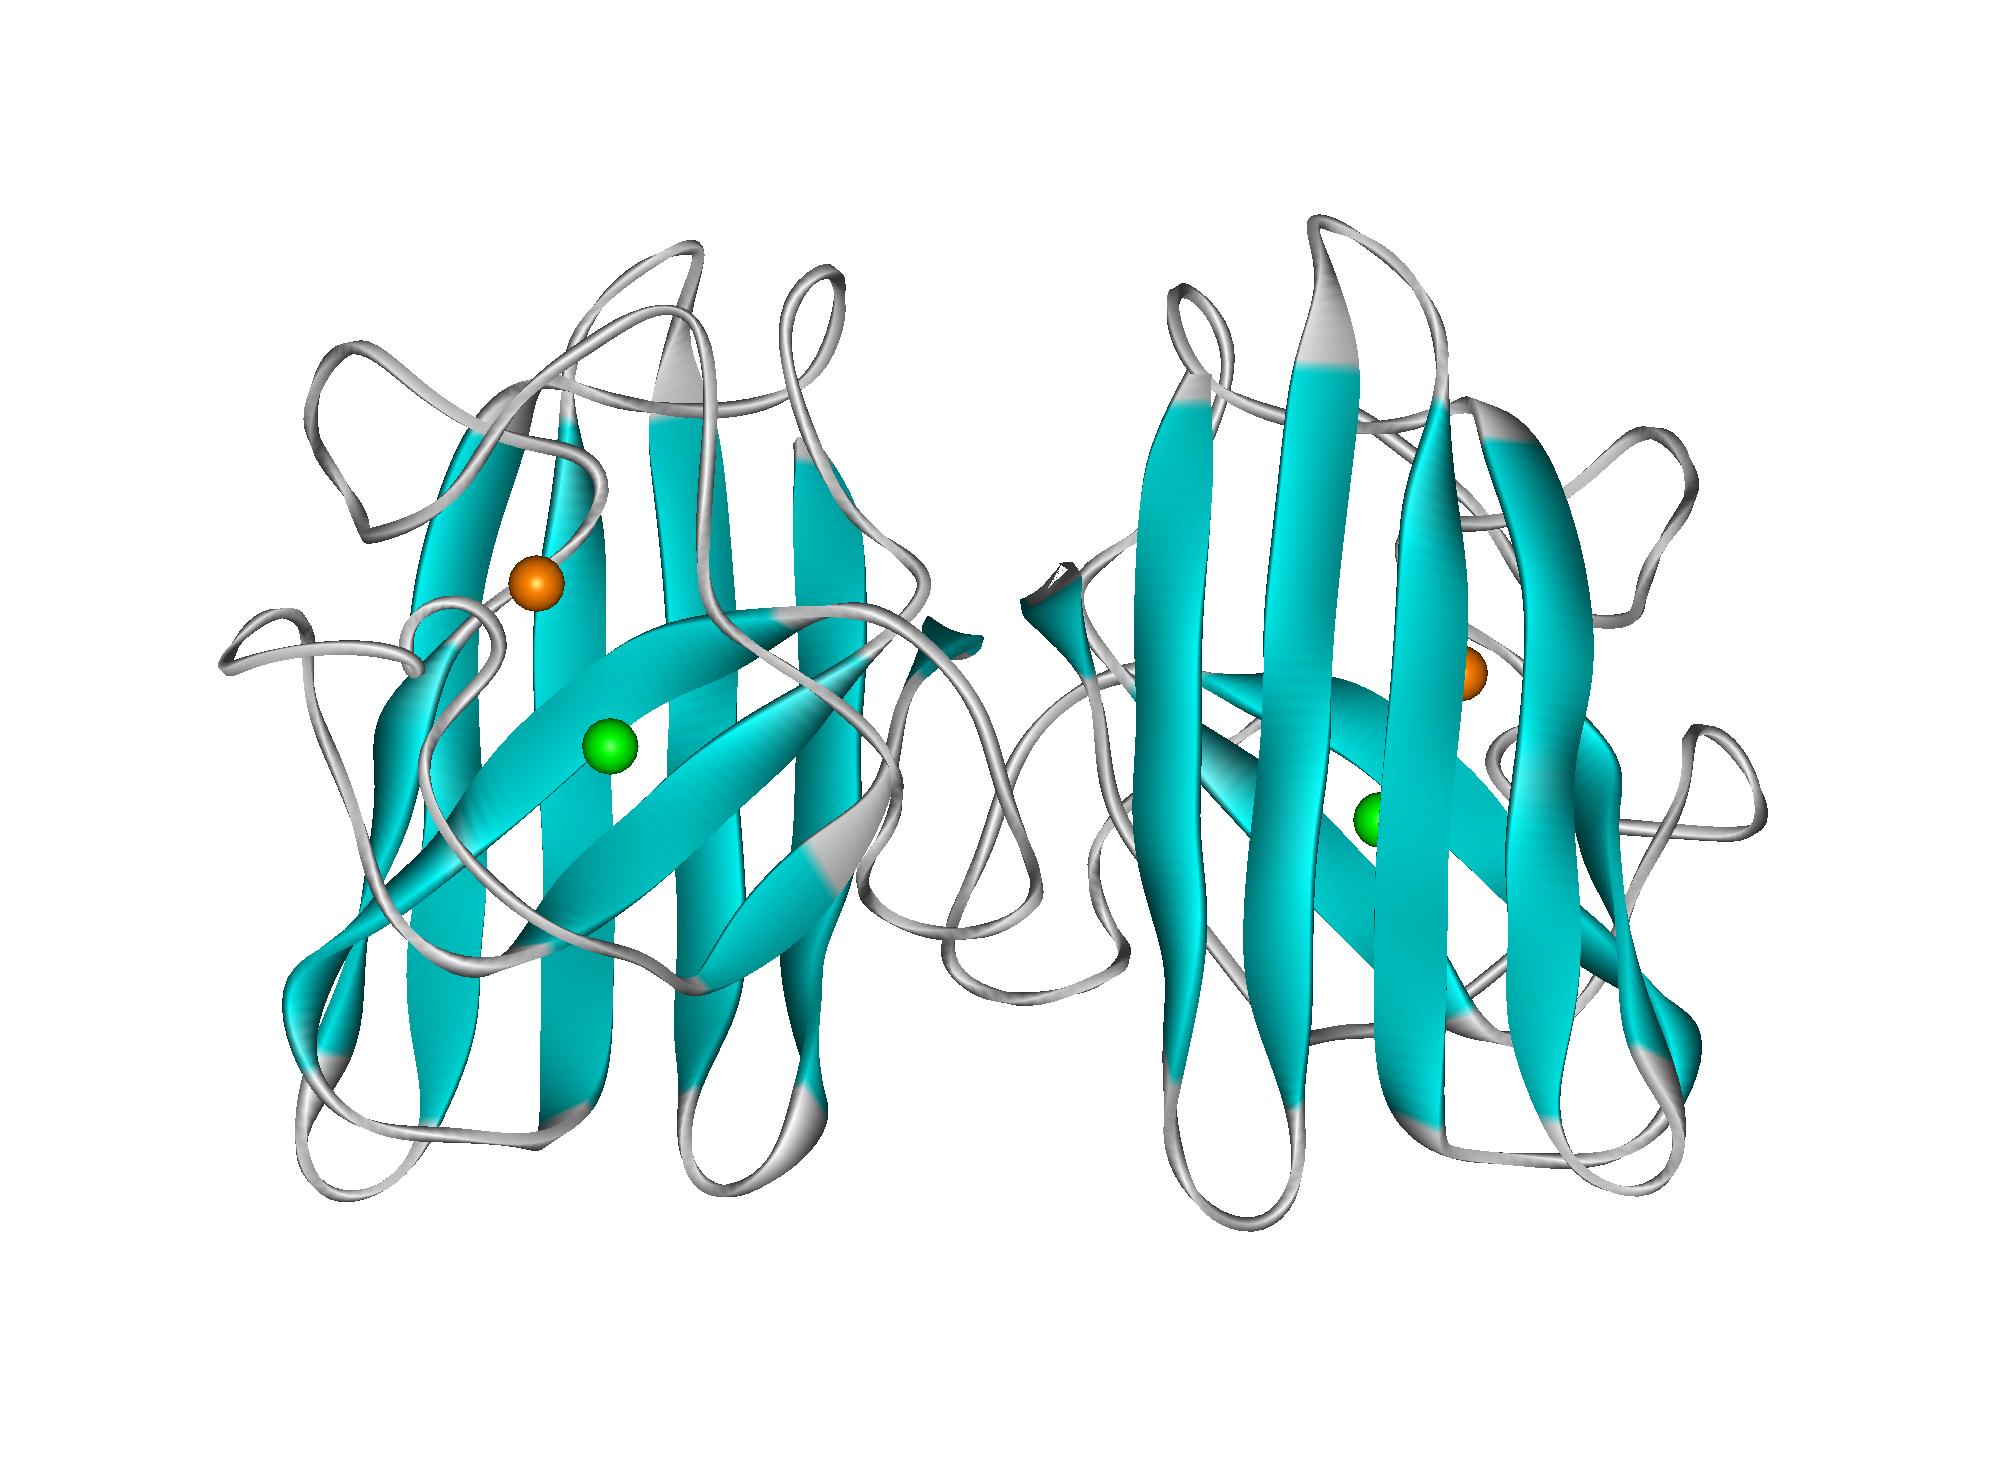
SOD1 protein molecule.
However, the apo (metal-depleted) wild-type SOD1 can become destabilise and undergo self-aggregation into an amyloid-like fibrillar structure that may implicate a possible cause of ALS, a neuro-degenerative disease. The actual atomistic mechanisms this can occur is not clearly understood but it is possible via destabilisation or reorientation at the dimeric interface.
One possible way to investigate this is to use D_ATA to track interactions between the two protein monomers from molecular simulation trajectories of SOD1 in water.
Due to large trajectory file size, this exercise uses a truncated trajectory file to just 39 frames, or about 30 ps. The idea is not to derive any conclusions base on the analysis, but rather to illustrate what results can be produced from D_ATA program.

Procedures
- Download the trajectory file (
SOD1 trajectory).
This file is generated from DL_POLY simulation runs. It consists of an SOD1 protein molecule (4374 atoms) with water molecules and sodium counterions, to give a total of 51843 atoms. Save this in D_ATA home directory (where d_ata executable file is located).
- Download the PDB template file (
SOD1 template).
Since DL_POLY HISTORY file does not contain the amino acid residues information, D_ATA will use this as a template to identify the type and source of interactions.
The template file contains the PDB structure with atom sequences match with those of HISTORY trajectory frames. The two protein monomers are labelled as SOD1 and SOD2,
Save this file in the D_ATA home directory.
- Edit and insert the filename of the downloaded trajectory file in d_ata.input, as shown below:
# Since there is only one file and hence the number 1.
1
HISTORY_sod1.gz
If your trajectory file is located in other folder, then remember to specify the path as well. If your D_ATA version cannot read the gzip compressed file, then use gunzip to uncompress it and change the filename accordingly.
Save and exit d_ata.input.
- Edit and view the d_ata.control file. Select the options as shown below:
Title for control file.
2              * Program mode: 1=typer, 2=typer and analyser.
0              * All-inclusive interaction mode (1=yes, 0=no).
sod1_template.pdb * PDB, gro, d_ata.template or 'none'
auto           * Periodic boundary condition type
40.0 0.0 0.0   * Cell vector a (x, y, z)
0.0 40.0 0.0   * Cell vector b (x, y, z)
0.0 0.0 40.0   * Cell vector c (x, y, z)
1 4374         * Group A: Atom range. Min Max or 'all'
1              * Molecule-based analysis (0 = off, 1=betwen molecule, 2=within molecule).
1              * No of configuration to skip
1              * DANAI tier level.
0.002          * Average count fraction threshold
2.5            * Distance threshold for H...D in HB interactions
120.0          * Angle threhold for HB interactions
4.5            * Distance threshold for C...C in HP interactions
1              * HB analysis
1              * HP analysis
Note that the PDB template is loaded and only the protein molecule will be analysed, by restricting the atom index range from 1 to 4374. The rest of the atoms and molecules, which consist of water molecules and counterions will be ignored.
The option also instructs D_ATA to identify interactions that occur between the molecules, or in this case, between the monomers. Interactions that occur within the monomers will be ignored.
Save and exit d_ata.control.
- Run D_ATA program at the home directory by simply type ./d_ata
At the end of analysis, D_ATA will produce the following information:
..
..
..
Looking for HP interaction...
Grand total HP C(alkyl)...C(alkyl) contacts = 288


Finish analysis.

Time taken to carry out analysis: 76.58 s

Files created in OUTPUT_PATH folder:
- d_ata.output
- d_ata.csf
- d_ata.results
- d_ata.results2
- A number of count-time profile files (count_XXX.results), if any.
  See d_ata.results for details (Under the AVERAGE COUNTS heading).
Examine each output file. Note that when a template file is provided, D_ATA will produce an additional file, d_ata.results2. This file shows type of interactions and the residues that involve in such interactions.
- Change control options such as number of atoms to analysis, analysis criteria, etc and rerun D_ATA.
Please refer to manual or D_ATA reference guide for more information on how to interpret output results.
For guidance how to interpret results produce from d_ata.results2, please refer to Chapter 3.4 of the D_ATA user manual.